 BALA.WORK
Stat Scout is a sports analytics platform designed to make real-time and historical data immediately legible. Every screen - from login to live dashboard - was engineered for clarity under information load.
My role: UI/UX Designer · 2024 · 3 weeks
The starting point
Sports dashboards typically drown users in raw numbers with no visual hierarchy. Coaches and analysts needed a tool where the most important metric is always the loudest thing on the screen.
Finding the idea
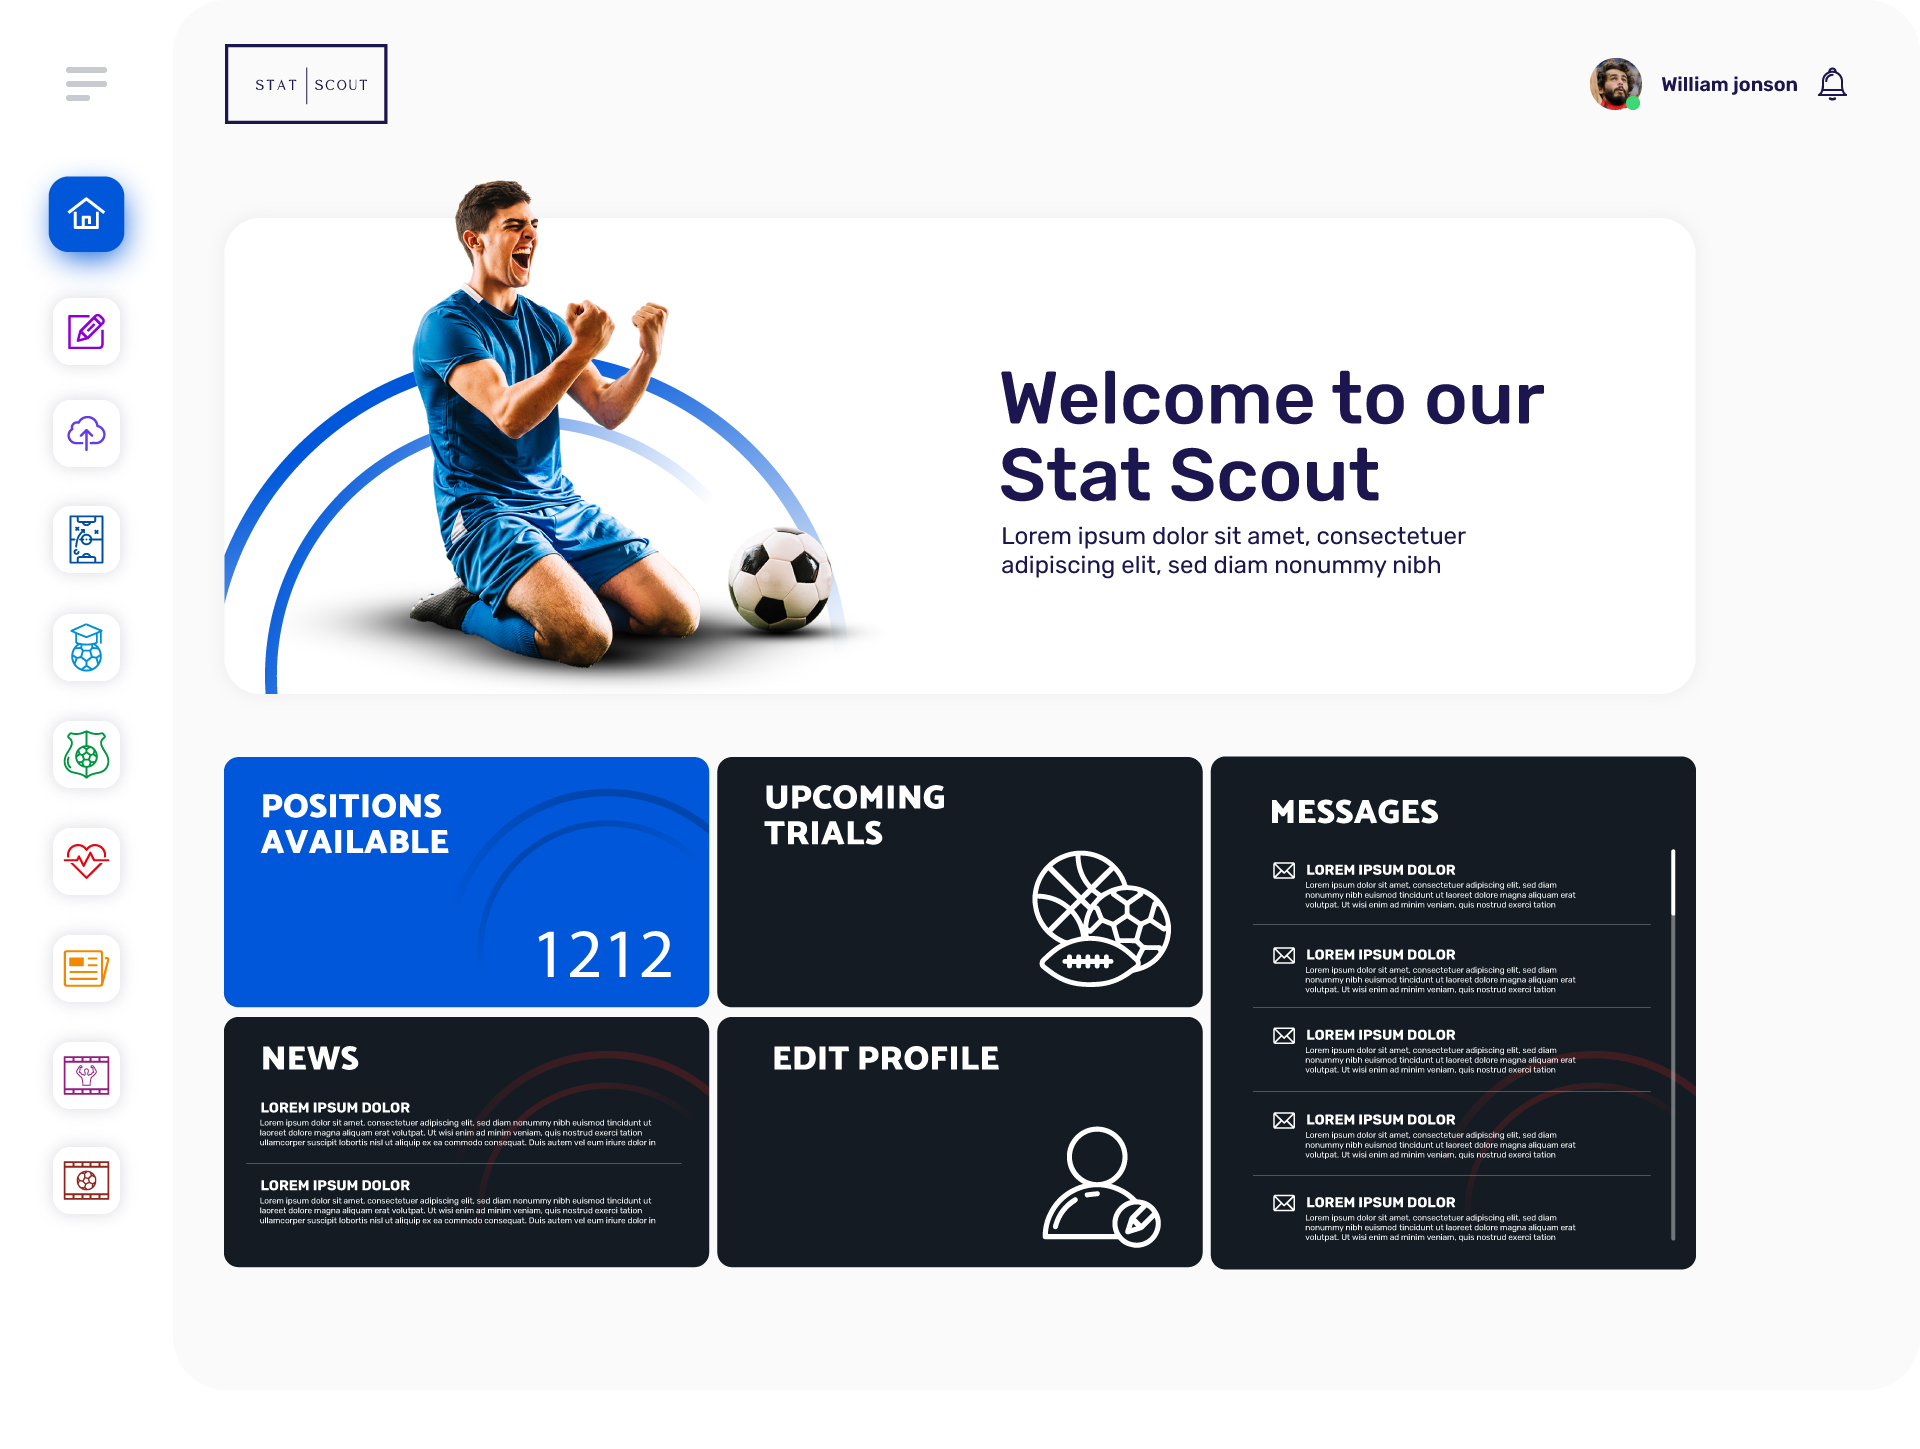
Started with information architecture: mapped every data point by decision priority. Used progressive disclosure - summary cards first, drill-down on demand. Dark theme for extended screen time. Color only used for signal, never decoration.
Making it real
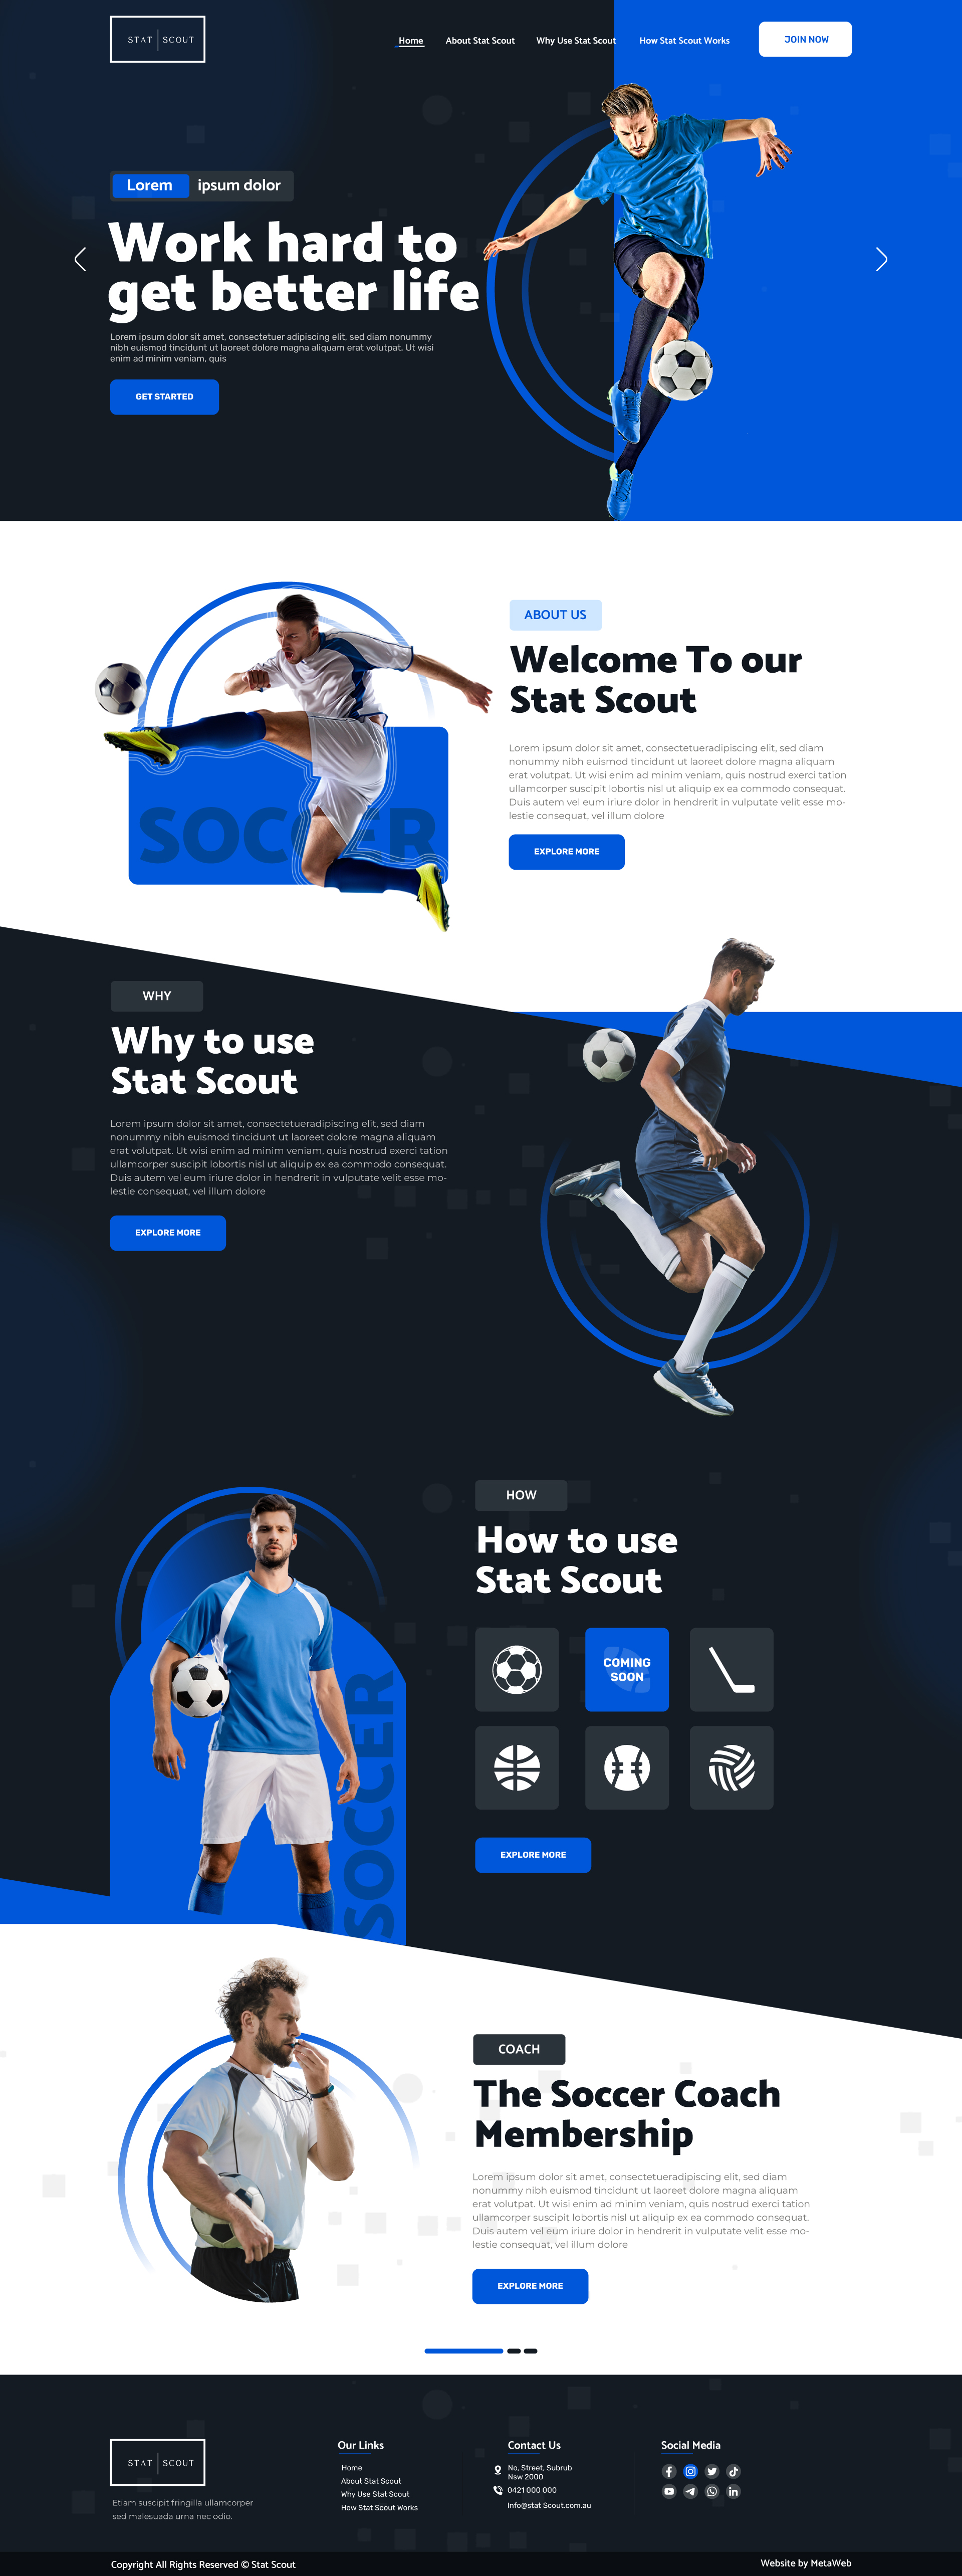
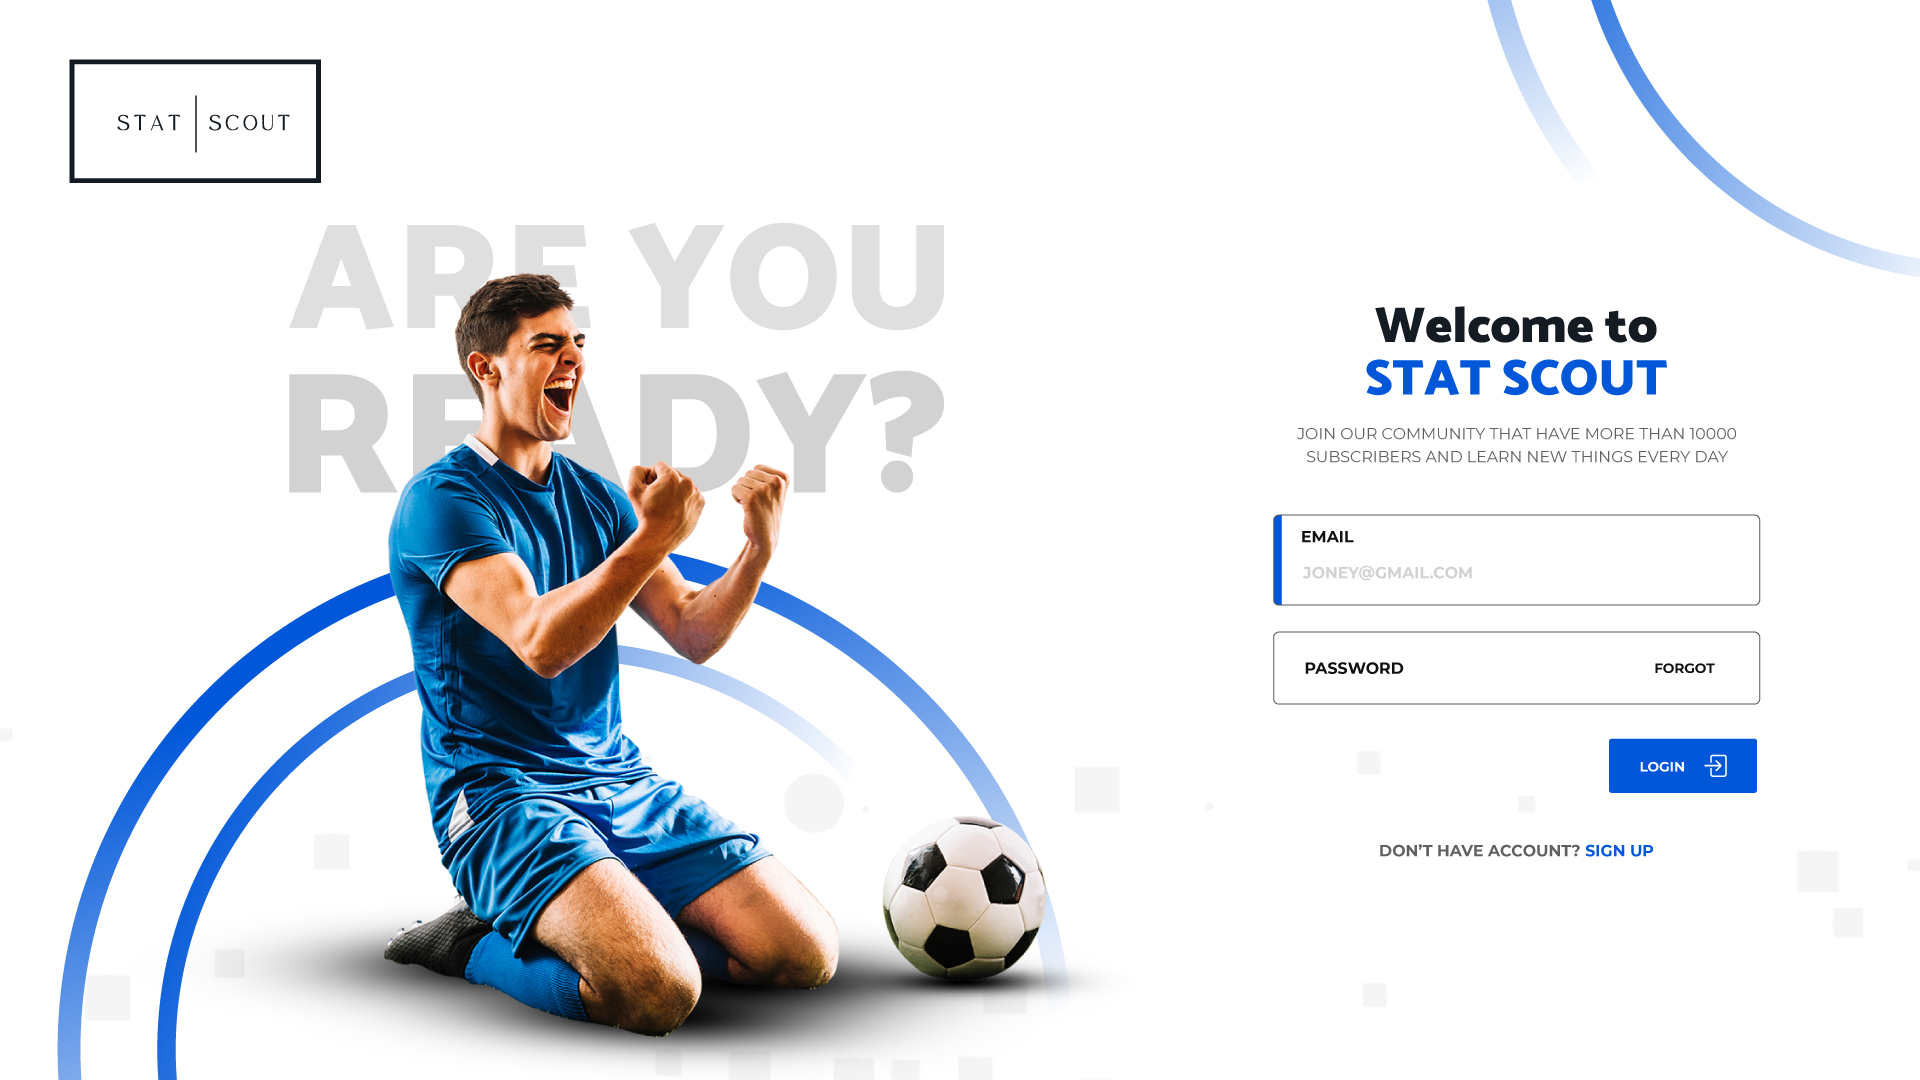
A three-screen product flow: onboarding login, a home overview with key metrics at a glance, and a deep-dive dashboard with charts, player cards, and live stat feeds - all consistent in visual language.
The work
What came together
- Full 3-screen UI delivered: Login, Home, Dashboard
- Data hierarchy established across all views
- Dark theme optimised for low-light stadium environments
- Component-ready layout for developer handoff